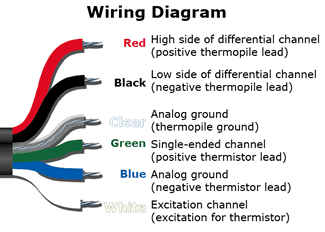
For starters, a voltmeter with microvolt accuracy is necessary since the target output of the sensor is only 30 to 60 microvolts per degree C. Dataloggers from Campbell Scientific have an accuracy of 0.33 microvolts, which is adequate to determine the temperature of the target to 0.01 C. Be careful not to confuse the resolution of the display with the fundamental accuracy of the voltmeter. Few voltmeters have the accuracy necessary to make a good measurement.
The voltage signal often needs filtering to improve the signal to noise ratio. The most typical filtering is 60 Hz integration, which filters out interference from nearby power sources. This may not be necessary in the middle of a field, but it is typically necessary in a laboratory environment.
After an accurate voltage measurement is made, it is necessary to convert the voltages from both the target sensor and the sensor body temperature into degrees C. This requires multiple steps. These steps are automatically done in a CSI datalogger, or done by downloading the program that comes with each sensor.
The next, more complex step, is to convert the voltage output from the target sensor to degrees C. Make sure the resolution of your device is to the appropriate range, as typically all signal sizes of IRRs vary between -1.0 and 1.5 mV. Place the positive and negative leads from your multimeter onto the red and black wires, respectively, of the IRR cable (see figure above for IRR wiring help). Record and mark the measurement made as “mV” for future reference. Now that we have taken all of the necessary measurements for a surface temperature reading, we need to make a few calculations to convert RT to a sensor body temperature.
Campbell Scientific dataloggers use an intrinsic function called “Therm109” in datalogger programs to convert RT to a temperature in °C. However, this can still be done manually by using the Steinhart-Hart equation below:
where A = 1.129241E-03, B = 2.341077E-04, and C = 8.775468E-08.
With the sensor body temperature (SBTempC) of the IRR calculated, we can finally proceed to incorporate the custom calibration coefficients for the final target temperature.
With every calibrated IRR sensor we sell, there is a set of custom coefficients which are needed to provide the user with the actual target temperature measurements desired. The custom coefficients are labeled mC2, mC1, mC0, bC2, bC1, and bC0 (as marked by the stars in the figure above). The equations below will show how these work. Two temporary variables, “m” and “b” which correlate with our calibration process, will be calculated as follows:

After calculating m and b, we take our mV measurement, and use our final equation below, to determine the IRR sensor target temperature in °C :

A couple of final comments: when taking measurements, ensure that your sensor remains in a stationary position, pointed at the target. Obstructing the sensor during measurement will cause incorrect readings, as well as holding onto the sensor body without the shield on, due to heat conduction effects. Additionally, taking the mV and RT measurements as concurrent as possible will provide optimal results. Provided below is a link to a starter excel spreadsheet that can be downloaded to help you take manual temperature measurements from your IRR. Simply fill in your custom calibration coefficients in the orange cells near the top and input your mV and RT measurements in the orange columns below, and you will have your desired target temperature in the green column. Happy measuring!
http://www.apogeeinstruments.com/files/IRR_Manual_Measurements.xlsx
Adam Del Toro
Mechanical Engineering


