
20 December 2011
14 December 2011
Amplified Sensors
 To help satisfy the needs of some of our customers, we offer an amplified version of our pyranometer and quantum sensors. This allows for easy integration into existing systems that are not designed for millivolt signals. There are two options: 2.5V and 5V. Where the number listed is the maximum output at the maximum light for which the sensor is calibrated it is also the minimum input voltage required to power the sensor. For example: the SP-215 has an output of 4.4V when the solar radiation is at its maximum of 1100 W/m2. This allows for some head room if the light level is higher due to reflected radiation. If the voltage supplied was only 4V the maximum output would be 4V which means that the sensor would output the same for any light level over 1000 W/m2. This is something to watch for if you are supplying the voltage with batteries.
 These sensors have been designed to have all the circuitry inside the head, the same as our non-amplified sensors. This means they are rugged and there is no worry about water damage to the circuit board. The circuitry is a basic non-inverting configuration of an operational amplifier (op-amp). The op-amp has been specifically chosen to have a low voltage offset and be physically small enough to fit inside of our current sensor body head. The op-amp has a max voltage specified at 5V which is why the maximum output of our amplified sensors is 5V. Included in the circuitry is a Zener diode that will short to ground if a voltage higher than 6V is applied. This keeps the main circuitry from getting destroyed if the sensor is wired incorrectly.
 These voltage ranges can still be limiting for some of our customers, which is why we are working on a 4-20mA output for our sensors that we will release early next year. This circuit will have an input voltage range of 5-36V, and will significantly surpass the voltage limits of our amplified sensor.
Skif Smith
Electrical Engineering
07 December 2011
Field of View
Due to recent product development, Apogee now offers three different options in choosing a Field-of-View (FOV ) for the SI-100 series infrared radiometers (IRRs). FOV is reported as the half-angle of the apex of the cone formed by the target (cone base) and the infrared radiometer detector (cone apex). It ultimately determines how much surface area your IRR can see at any given distance and tilt angle.
The target area is a circle from which 98 percent of the radiation viewed by the infrared radiometer detector is emitted. A center-weighted average of that target area is used to determine the mV signal. As the tilt angle is increased from zero degrees at a given height, the target area increases and transforms from being a circle to an ellipse as seen in the figure below.
We can also observe that as the tilt angle is increased to high values such as 60 degrees, the target area increases significantly. In addition, the difference between target areas of the three models can become quite contrasting. Those attempting to measure an accurate average of the target area in question, whether it be a plant canopy or a highway, must determine if the desired target area covers the desired destination appropriately. Measuring more or less of the desired area can result in questionable results. To help with this uncertainty, Apogee has developed a simple tool that can be accessed on our website:
http://www.apogeeinstruments.com/content/fov-calculations.xls

This simple spreadsheet and illustration above allows the user to input the tilt angle (“Angle from Normal to Surface”), the height above surface, and the FOV depending on which IRR model is in use, as seen in the green cells. The result is the approximated target area as seen in the highlighted yellow cell. It should be noted that only the green cells should be edited, as not to interfere with cell calculation formulas. Due to the conical nature of the FOV, high tilt angles above approximately 65°, 70°, and 75° for the SI-111, SI-121, and SI-131 models, respectively, can yield impractical results in the spreadsheet due to “viewing” a near-infinite surface area. Likewise, Apogee recommends mounting the sensors below such angles.
The FOV calculation spreadsheet can be used as a powerful tool in planning measurements such as deciding the model of sensor needed, an appropriate height and angle to mount your IRR, etc.
Apogee’s FOV calculation spreadsheet: helping you make better measurements.

Adam Del Toro
Mechanical Engineering
The target area is a circle from which 98 percent of the radiation viewed by the infrared radiometer detector is emitted. A center-weighted average of that target area is used to determine the mV signal. As the tilt angle is increased from zero degrees at a given height, the target area increases and transforms from being a circle to an ellipse as seen in the figure below.
We can also observe that as the tilt angle is increased to high values such as 60 degrees, the target area increases significantly. In addition, the difference between target areas of the three models can become quite contrasting. Those attempting to measure an accurate average of the target area in question, whether it be a plant canopy or a highway, must determine if the desired target area covers the desired destination appropriately. Measuring more or less of the desired area can result in questionable results. To help with this uncertainty, Apogee has developed a simple tool that can be accessed on our website:
http://www.apogeeinstruments.com/content/fov-calculations.xls

This simple spreadsheet and illustration above allows the user to input the tilt angle (“Angle from Normal to Surface”), the height above surface, and the FOV depending on which IRR model is in use, as seen in the green cells. The result is the approximated target area as seen in the highlighted yellow cell. It should be noted that only the green cells should be edited, as not to interfere with cell calculation formulas. Due to the conical nature of the FOV, high tilt angles above approximately 65°, 70°, and 75° for the SI-111, SI-121, and SI-131 models, respectively, can yield impractical results in the spreadsheet due to “viewing” a near-infinite surface area. Likewise, Apogee recommends mounting the sensors below such angles.
The FOV calculation spreadsheet can be used as a powerful tool in planning measurements such as deciding the model of sensor needed, an appropriate height and angle to mount your IRR, etc.
Apogee’s FOV calculation spreadsheet: helping you make better measurements.
Adam Del Toro
Mechanical Engineering
30 November 2011
Daily Light Integral: Measuring Light for Plants
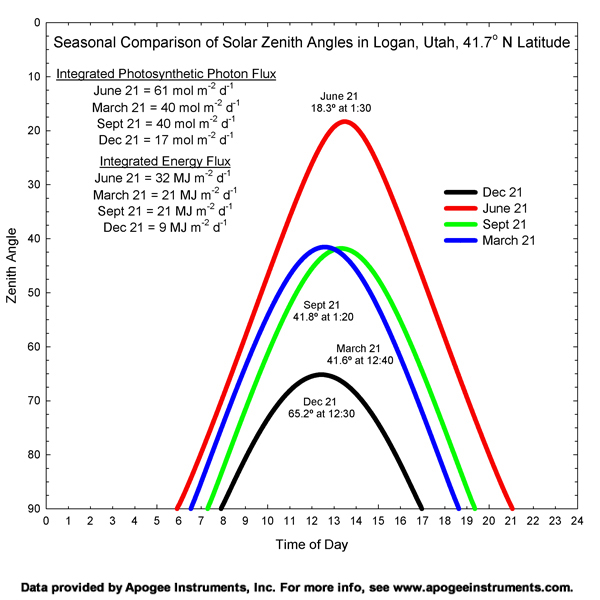 |
| This graph illustrates the year-round variability of global horizontal irradiance at Apogee Instruments in Logan, Utah. |
This time of year tends to bring a renewed challenge to my own circadian rhythm, so for me it's not hard to imagine that certain greenhouse crops and even our own nonnative houseplants are experiencing a similar effect during the winter months. Many greenhouses will provide supplemental lighting to better control the photoperiod that each crop receives. Since growth is determined by the total integrated amount of photons that a plant receives each day, this daily light integral must be measured to accurately predict plant growth. A basic quantum meter can be used to measure the instantaneous photosynthetic photon flux (PPF) in micromoles of photons per meter squared per second (µmol m-2 s-1), but ultimately it is the sum total of moles of photons per meter squared per day (mol m-2 d-1) that must be quantified.
Under constant electric lights the conversion from µmol m-2 s-1 to mol m-2 d-1 is straightforward. It is determined by multiplying the instantaneous PPF by the number of seconds in the photoperiod. One of the most highly used section of our website shows examples of this calculation: http://www.apogeeinstruments.com/conversions/daily.html.
It’s not possible to use a constant multiplier with variable lighting, so a quantum meter that has an integrating capability is necessary to determine the daily light integral under variable lighting. The Apogee MQ series meter is designed to measure and store this value each day.
 |
| {Impatiens Walleriana Photo by http://www.hear.org/starr/} |
In the end, measuring daily light integral will help to determine the need to manipulate our environment to get high quality plant growth in the winter. It’s just too bad that I can’t walk around with my own supplemental lighting to help alleviate the long, dark winter nights.

Jacob Bingham
Applications Engineer
23 November 2011
AGU 2011 Fall Meeting

We have been attending the AGU Fall Meeting as an exhibitor for five years. According to http://www.agu.org/meetings The AGU Fall Meeting is the largest worldwide conference in the geophysical sciences, attracting nearly 20,000 Earth and space scientists, educators, students, and policy makers. This meeting showcases current scientific theory focused on discoveries that will benefit humanity and ensure a sustainable future for our planet.
AGU was established in 1919 and officially incorporated in 1972. It now has over 60,000 members all focused toward the goal of “promoting discovery in Earth and space science for the benefit of humanity.” Our goals at Apogee have always been focused on creating innovative instrumentation for measuring climate change, improving sustainable food production and developing renewable energy. We enjoy being part of such an important work and providing the tools necessary for today’s scientists to build a better future for our world.
At this year’s show we will be exhibiting some new products. We are very excited about our new Infrared Radiometer Meter. Come over to our booth to try it out for yourself. This meter is great for everything, from monitoring canopies, to spot checking permanent infrared radiometer installations. We also are going to be showing our new product prototype of our Aspirated Radiation Shield. This product will be on sale in a few short months. The shield is designed to run on low power and will provide accurate air temperature readings in crosswinds. Come and see it for yourself, and watch for a product announcement on our Apogee blog when it is available for sale.
We will be at booth #1717 in San Francisco. See you there!
Whitney Mortensen
Marketing & Graphic Design
16 November 2011
Specifications
 Several years ago when our specification sheets did not include the same information they do now, a customer looked at a close-up photo of our pyranometer (with a diameter of 23.50 mm) and concluded that the sensor was the size of a dinner plate! Initially we were shocked at how someone could imagine something so preposterous. Upon closer introspection and self-examination we realized that the fault was ours in not effectively communicating information about our product.
What information should be on our specification sheets? This issue has come up repeatedly through the years at Apogee. In considering this it is helpful to keep in mind the purpose of a specification sheet. Foremost is that they are a means of communication to potential users what the product is, what it does and how it performs. Three concerns are preeminent in developing an effective specification, 1) what information should be included, 2) who is the intended audience and 3) how should the information be structured.
What information should be included? Many companies are concerned that if they are giving away too much information it could allow a competitor to reverse engineer their product. If the geometry of the product plays a role in performance, how much information should be included to communicate the dimensions of the product for a customer without releasing critical information? Additionally, what are the key parameters that are critical to potential users? We have addressed this by focusing on a detailed breakdown of how our products perform while we strive to produce the best quality products possible. While some of our products have been knocked-off, a quick examination demonstrates the difference in quality between the original and the imitation.
Who is the audience? For scientific instruments, your audience frequently ranges from Ph.D. level scientists to elementary teachers looking for tools to get students excited about science. How do you communicate the detailed information a researcher seeks without losing the interest of a more casual customer? Our specification sheets have evolved to include a photograph of the product with several brief paragraphs that describe what the product is and how it is used. This is then followed by a table, which contains detailed information on the product’s performance. Following the table is generally an illustration that shows the dimensions. This format allows someone unfamiliar with the product to first learn about the sensor. Those more concerned with detail performance can easily find that information in the table.
 How should the information be presented? In 2006 Apogee advertised for a Calibration Technician/Technical Writer. We decided upon a recent psychology graduate that was looking to work while his wife finished her degree before he pursued a graduate degree in law. Ray was with Apogee for a little over a year but in that time had far reaching impacts on how Apogee communicated complex scientific ideas. Unknown to us at the time of hiring, Ray had an eye for solid design layout and composition, accompanied with detailed familiarity using Adobe Illustrator, as well as a strong work ethic. When not occupied with calibrating sensors, Ray would look over our documentation and then propose ways to communicate complex ideas with an illustration. These became integrated into specification sheets, owner’s manuals and general product information on our website and are still in use today.
Specification sheets are one more tool in effective communication between manufacturers and customers. I am excited about the direction of future communication options as advances in technology facilitate two-way communication between parties. Apogee has always sought feedback from customers and as Apogee expands marketing efforts to include social media avenues such as this blog, Facebook, and online surveys, it is our hope that our customers feel their voice is heard. Making better measurements is dependent on common understanding of what researchers are trying to measure and how Apogee can help address those needs. Effective communication, whatever the medium, can only help that process.
Devin Overly
General Manager
09 November 2011
Better Know a Distributor - Campbell Scientific
The ‘Better Know a Distributor’ series highlights other companies that distribute and re-sell Apogee products.
Apogee Instruments and Campbell Scientific are more than just neighbors on the same street. Campbell Scientific has helped Apogee develop and grow in many ways. Campbell Scientific re-sells and supports most of our sensors in their weather stations. Having Apogee products included on Campbell Scientific’s price list is a testament to the quality of the products Apogee manufactures. For anyone who has wanted to know more about our great neighbor, Campbell Scientific, here is a brief history.
Campbell Scientific now employs over 200 people in their Logan offices. They sell product all over the world and have offices in Canada, France, Spain, Germany, Australia, Africa and Brazil.
Being neighbors and sister-companies with Campbell Scientific has allowed us to work together on various projects, from marketing to product development. Campbell Scientific has helped mentor Apogee through numerous growing pains and has provided valuable insight directly though formal representation on our Board of Directors as well as informally through such things as including us in their company-wide breakfasts. This way, the customers of both companies can benefit from our shared experience. Campbell Scientific is a great company to work with, and we are definitely glad that they are our neighbors.
Sources:
www.campbellsci.ca/Download/CorpProf.pdf
Whitney Mortensen
Marketing & Graphic Design
Apogee Instruments and Campbell Scientific are more than just neighbors on the same street. Campbell Scientific has helped Apogee develop and grow in many ways. Campbell Scientific re-sells and supports most of our sensors in their weather stations. Having Apogee products included on Campbell Scientific’s price list is a testament to the quality of the products Apogee manufactures. For anyone who has wanted to know more about our great neighbor, Campbell Scientific, here is a brief history.
Campbell Scientific was organized in 1974 by Eric and Evan Campbell with initial capital from themselves, six brothers, and their father.
Eric had an interest in science at an early age. His high school science project (class of 1964) consisted of measuring the surface temperature of the moon by using an infrared sensor that he designed and built from scratch. He was introduced to making field measurements while working part time as a student at Utah State University. The research farm at the University provided an excellent environment for testing new ideas. Soon he had his own business, Logan Scientific Instruments, which produced soil psychrometers and the electronics to read them. He eventually sold his company, allowing him to finance his degree in physics with a minor in electrical engineering.
Evan became a strong asset during this time because of his interest and involvement in mechanical systems. He loved mechanical design and was pursuing a degree in manufacturing engineering.
The Campbell brothers combined their experience and education, focusing their efforts on establishing an emerging company, Campbell Scientific. Dr. Gaylon Campbell, the oldest brother and a professor at Washington State University, provided direction and help.
Campbell Scientific now employs over 200 people in their Logan offices. They sell product all over the world and have offices in Canada, France, Spain, Germany, Australia, Africa and Brazil.
Being neighbors and sister-companies with Campbell Scientific has allowed us to work together on various projects, from marketing to product development. Campbell Scientific has helped mentor Apogee through numerous growing pains and has provided valuable insight directly though formal representation on our Board of Directors as well as informally through such things as including us in their company-wide breakfasts. This way, the customers of both companies can benefit from our shared experience. Campbell Scientific is a great company to work with, and we are definitely glad that they are our neighbors.
Sources:
www.campbellsci.ca/Download/CorpProf.pdf
Whitney Mortensen
Marketing & Graphic Design
02 November 2011
Accelerated Aging

One type of product in which we at Apogee take particular pride is our short-wave sensors; i.e. pyranometer and quantum sensors. These rugged, optical sensors can withstand harsh outdoor environments, submersion in salt water, and are vibration tolerant. Yet, this is not enough for us.
We perform accelerated aging tests on our sensors to provide confidence in their long-term stability. Accelerated aging tests cannot directly predict the product lifetime in the field, but they do provide assurance that the product is rugged enough to withstand expected operating conditions. Accelerated aging tests often involve high levels of UV light, high temperature and humidity, high vibration, or some combination of extreme conditions. In this case we used extreme temperature cycling. We cycled a group of sensors every three hours from -20 to 60 C (-4 to 140 F). After 3 months, and more than 350 temperature cycles, the sensors did not fail.
 Although our sensors are rugged, we recommend periodically, minimally every year, checking the output of radiation sensors against the sun on clear days using our free Clearsky Calculator. The user enters the location of the sensor (longitude, latitude, time zone) as well as day of year and environmental conditions and an expected output of the sensor is calculated. The sky must be clear. Our experience is that the calculated radiation intensity is within 2% of the actual solar intensity. If it does not match, the user should re-clean and inspect the sensor and again check against the Clearsky Calculator. If it still does not match then please give us a call and we can help resolve issues and, if necessary, help you get it recalibrated.
 We want to ensure that we have a sensor that will continue to operate whether continuously submerged, frozen in arctic conditions or heated under the tropical sun.
Seth Humphries
Product Development Scientist
19 October 2011
New Products: Infrared Radiometer Meter (MI-210) and Ultra-Narrow Infrared Radiometer (SI-131)
Apogee Instruments is pleased to announce the release of our Infrared Radiometer Meter and our Ultra-Narrow Infrared Radiometer. Some of their features and uses are listed below.
Features
 The IRR meter has a tenth degree resolution with ±0.3 C accuracy. Each meter is calibrated individually in order to achieve this accuracy so you can be confident in the reading.
This meter has the same basic modes for saving data as our other meters including:
Uses
The IRR Meter can be used for spot measurements of canopy or road temperatures. It can also be used to verify the accuracy of IRR Sensors that are wired to a datalogger. This is especially convenient when wondering if a sensor needs to be recalibrated.
SI-131
The SI-131 has a half angle of 14 degrees compared to 18 and 22 degrees of our current infrared radiometers. This will allow for measurements of smaller areas with less chance of seeing anything unwanted. The sensor has an accuracy of ±0.3 C.
These are some products we have been perfecting for a long time so that you can ‘Make Better Measurements.’

Skif Smith
Electrical Engineering
Features
 The IRR meter has a tenth degree resolution with ±0.3 C accuracy. Each meter is calibrated individually in order to achieve this accuracy so you can be confident in the reading.
This meter has the same basic modes for saving data as our other meters including:
- 99 – Manually saved sample points – These points are saved by pushing the sample button.
- 99 – Automatically saved points – These points are saved in log mode every 30 minutes. They are an average of data taken every 30 seconds.
- 99 – Daily Averages – The meter calculates when a day has passed and saves an average of the 30 minute averages.
Uses
The IRR Meter can be used for spot measurements of canopy or road temperatures. It can also be used to verify the accuracy of IRR Sensors that are wired to a datalogger. This is especially convenient when wondering if a sensor needs to be recalibrated.
SI-131

The SI-131 has a half angle of 14 degrees compared to 18 and 22 degrees of our current infrared radiometers. This will allow for measurements of smaller areas with less chance of seeing anything unwanted. The sensor has an accuracy of ±0.3 C.
These are some products we have been perfecting for a long time so that you can ‘Make Better Measurements.’
Skif Smith
Electrical Engineering
12 October 2011
Emissivity Correction
 Temperature of an object is determined by three modes of heat transfer: conduction, convection, and radiation. While conduction and convection are generally easier to understand, radiation is often the most important mode of heat transfer. Understanding the underlying principles of radiation heat transfer helps to accurately measure surface temperatures at a distance with Apogee’s Infrared Radiometers (IRR). In this post I outline the essential principles in order to help you make better measurements.
Blackbody Radiation
All objects above 0 K (-273.15°C) emit radiation at the surface, due to the internal energy contained within the object. Radiation is continuously being emitted from surfaces and being absorbed, transmitted, and reflected. Some surfaces emit or absorb, for instance, better than others. This is mainly due to a surface condition called emissivity, which is determined by color, finish, and intrinsic material properties. Emissivity is a ratio of how well a surface performs as an emitter of infrared radiation in comparison to what is commonly called a blackbody, or ideal radiator. A blackbody is described as follows:
- A blackbody absorbs all incident radiation, regardless of wavelength and direction.
- For a prescribed temperature and wavelength, no surface can emit more energy than a blackbody.
- Although the radiation emitted by a blackbody is a function of wavelength and temperature, it is independent of direction. That is, the blackbody is a diffuse emitter [1].
Generally speaking, a blackbody is the perfect absorber and emitter. It is the standard we compare other radiating surfaces against. No other surface absorbs more energy or emits it than a blackbody. In addition, no radiation emitted from a blackbody is reflected from other sources.
According to the Stefan-Boltzmann Law, the emissive power of a blackbody is Eb=σT4, where
and the temperature is measured in Kelvin. Accordingly, for a non-blackbody, the emissive power is Eb=εσT4, where ε is the emissivity of the surface being considered (0<ε<1), and ε = 1 for a blackbody. The chart below shows emissivities for common materials. Additional values can be found at its source: http://www.engineeringtoolbox.com/emissivity-coefficients-d_447.html.

For plant scientists, it might also be interesting to consider the emissivities documented for various plant leaves and diverse vegetation over different wavelengths (http://g.icess.ucsb.edu/modis/EMIS/html/leaf.html).
Emissivity Correction
If emissivity isn’t taken into account, the surface temperature of an object may appear to be emitting more radiation, due to the addition of reflective radiation for instance, than it really is and thereby giving us an incorrect perception for the emissive power or temperature of that surface. This can be especially true for an IRR sensor that has been calibrated to a nearly standard blackbody surface. The calibration procedure for Apogee’s IRR sensors ( http://www.apogeeinstruments.com/content/SI-calibrationposter.pdf ) shows just that.
The question then is: how can I adapt for such a situation?
Appropriate correction for target emissivity is required for accurate surface temperature measurements. However, the simple correction that is commonly made, dividing the measured temperature by the target emissivity, is incorrect because it does not account for reflected radiation. The radiation detected by an infrared radiometer includes two components: 1) the radiation directly emitted by the target surface, and 2) reflected radiation from the background. The second component is often neglected. The ratio of the two components in the radiation detected by the radiometer is weighted according to the emissivity (ε) of the target surface:
Which after substitution of the Stefan-Boltzmann Law and rearranging, we get:


Conclusion
In almost all situations, having a precise IRR sensor, such as Apogee’s ±0.2°C accurate IRR sensors won’t be enough. Emissivity correction is required to minimize error in your data. Whether you are using it in on a plant canopy or monitoring icy road conditions, emissivity correction will help you make better measurements.
References
[1] “Fundamentals of Heat and Mass Transfer” Incropera, F.P., Dewitt, D.P., et. al. 6th Ed. 2007, pg 736.
[2] “A Review of the Physics for Emissivity Correction of Infrared Temperature Measurements” URL: http://www.apogeeinstruments.com/content/SI-emissivitycorrection.pdf.
Adam DelToro
Mechanical Engineering
05 October 2011
Comparisons in Quantum Sensor Output for Different Light Sources

Apogee offers quantum sensors that are calibrated for either sunlight or electric light. The reason for this is due to the significant differences in spectral output among light sources. The following graphs illustrate those differences.
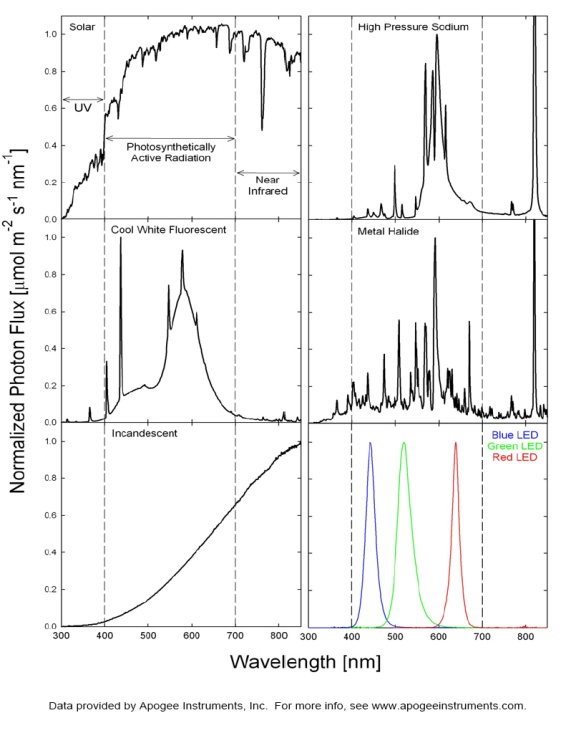
Here at Apogee, our quantum sensors for electric lighting are calibrated under high output T5 fluorescent lamps. The above differences in response indicate that there will be differences in sensor output if it does have a perfect spectral response. While the difference in calibration is less than 10% between electric light calibration (T5s) and sunlight calibration, it is also important to note the differences between T5 and other common electric light sources. The following table summarizes differences among lamp types.
-->
Light Source
|
Electric Calibration
|
Sunlight Calibration
|
T5 Fluorescent
|
Calibration Reference
|
9.1% High
|
T12 Fluorescent
|
2.2% low
|
6.9% high
|
Metal Halide
|
1.7% low
|
7.4% high
|
High Pressure Sodium
|
6.2% low
|
2.9% high
|
Sunlight
|
9.1% low
|
Calibration Reference
|
In the end, all quantum sensors will have imperfections in their spectral response, and thus will introduce errors. Unfortunately, science rarely if ever has the convenience of working in absolutes.
A note on LED lighting: due to the imperfect spectral response of all quantum sensors and meters, these broadband sensors are less accurate for measuring the narrow spectral output of some LEDs. Quantum sensors can accurately measure broad-spectrum white LEDs, however. Quantum sensors can be used to provide a relative output of LEDs over time and temperature, but they can have errors of over 20% for some narrow wavelength LEDs. A spectroradiometer is the most accurate instrument for characterizing the absolute PPF of narrow band LEDs.
Jacob Bingham
Applications Engineer
28 September 2011
American Society of Agronomy
 |
| {Photo from https://www.acsmeetings.org} |
This year Apogee is sponsoring two workshops prior to the meetings with Decagon Devices. The workshops are “Soil Moisture and Hydraulic Properties Measurement Instrumentation Theory, Application, and Hands-on Training” and “Plant Measurements from Leaf to Canopy: Light and Temperature Interaction.” Apogee has sponsored workshops in the past with Decagon and these have proven to be great experiences to work with researchers using a variety of instruments from several companies.
One of the things I like best about tradeshows and annual meetings is the interaction with customers. Many times marketing consists of putting out information unidirectionally. Print ads, websites and many other marketing avenues do not allow us to engage with our customers and discover if the intended concept was received correctly. Tradeshows allow us to do this, which in turn leads to improvements in how we communicate through our website and other medium.
At this year’s meeting we will be introducing an aspirated radiation shield, a hand-held meter for our infrared sensor and a new field-of-view option for our infrared sensor. We have also developed a 4 – 20 milliAmp output for our solar radiation sensors. We look forward meeting you at this year’s meeting. Please stop by booth 606 and say hello.
* ASA combines each year with the Crop Science Society of America (CSSA) and the Soil Science Society of America (SSSA) for their annual meetings. We used the letters ASA to make the post more concise. We are excited to join with the Canadian Society of Soil Science for this years meeting.
Devin Overly
General Manager
21 September 2011
Long-term drift: When is recalibration warranted?
I went to my dentist yesterday morning for a 6-month cleaning and check-up. Since I have had no special dental problems for several years, I quizzed him about the need for inspections every 180 days. He replied with an eloquent summary of the microbiological risks of letting small problems go exponential and turn into big problems. OK. So I will be seeing him again next spring.
 Microbes don’t normally cause drift in environmental sensors, and drift rates rarely go exponential, but we could all use a wise old dentist to remind us to floss (a.k.a. keep our sensor optics clean). Even with conscientious preventative maintenance, sensors, like teeth, need periodic check-ups. Some sensors in some environments can benefit from recalibration every 6 months. Other sensors, in other environments, can be rock-solid stable for 6 years. Few manufacturers have taken the time to rigorously characterize drift rates as a function of the environment the sensor (or meter) was used in. Even when the recommended interval for recalibration is based on good statistical data, most users ignore it. How many users follow the recommended recalibration interval of two years for Campbell Scientific dataloggers?
Some manufacturers make a significant profit from their recalibration services and recommend frequent recalibration without the data to help users know when it is really warranted. Both Campbell Scientific and Apogee strive to help users understand when recalibration is warranted. We also offer low cost and fast turnaround for recalibration services.
 Apogee is working to build a statistical database for the drift rate of our sensors in a wide range of environments. Many apparent drift problems can be solved by appropriate cleaning in the field (www.apogeeinstruments.com/infraredradiometer/cleaning.html). Our Clear Sky Calculator (www.clearskycalculator.com) was developed so that users of all types of radiation sensors could use the sun as a calibration lamp. We are pleased with the expanding use of this on-line calculator. It has helped many users fix problems without having to disconnect the sensor and call us for an RMA. This calculator has also been useful in identifying errors in software, such as an incorrect multiplier.
One effective way to test for drift is to put two sensors side by side and compare their output. If the sensors have the same output, either they are both still accurate, or they have both drifted down at the same rate. Alternatively, purchasing a new sensor and putting it next to an older sensor in situ is an effective way to determine the need for recalibration. The new Apogee hand-held infrared meter (www.apogeeinstruments.com/infraredradiometer/meter-pricing.html) provides a unique opportunity to check the accuracy of IR sensors in field installations.
We look forward to working with you in the quest to make better measurements. Keep flossing.

Bruce Bugbee
President
 Microbes don’t normally cause drift in environmental sensors, and drift rates rarely go exponential, but we could all use a wise old dentist to remind us to floss (a.k.a. keep our sensor optics clean). Even with conscientious preventative maintenance, sensors, like teeth, need periodic check-ups. Some sensors in some environments can benefit from recalibration every 6 months. Other sensors, in other environments, can be rock-solid stable for 6 years. Few manufacturers have taken the time to rigorously characterize drift rates as a function of the environment the sensor (or meter) was used in. Even when the recommended interval for recalibration is based on good statistical data, most users ignore it. How many users follow the recommended recalibration interval of two years for Campbell Scientific dataloggers?
 Some manufacturers make a significant profit from their recalibration services and recommend frequent recalibration without the data to help users know when it is really warranted. Both Campbell Scientific and Apogee strive to help users understand when recalibration is warranted. We also offer low cost and fast turnaround for recalibration services.
 Apogee is working to build a statistical database for the drift rate of our sensors in a wide range of environments. Many apparent drift problems can be solved by appropriate cleaning in the field (www.apogeeinstruments.com/infraredradiometer/cleaning.html). Our Clear Sky Calculator (www.clearskycalculator.com) was developed so that users of all types of radiation sensors could use the sun as a calibration lamp. We are pleased with the expanding use of this on-line calculator. It has helped many users fix problems without having to disconnect the sensor and call us for an RMA. This calculator has also been useful in identifying errors in software, such as an incorrect multiplier.
 One effective way to test for drift is to put two sensors side by side and compare their output. If the sensors have the same output, either they are both still accurate, or they have both drifted down at the same rate. Alternatively, purchasing a new sensor and putting it next to an older sensor in situ is an effective way to determine the need for recalibration. The new Apogee hand-held infrared meter (www.apogeeinstruments.com/infraredradiometer/meter-pricing.html) provides a unique opportunity to check the accuracy of IR sensors in field installations.
We look forward to working with you in the quest to make better measurements. Keep flossing.
Bruce Bugbee
President
14 September 2011
Apogee's Origin Story
I started working in graphic design and marketing at Apogee in June of 2010. I love the feel of working for a small business. I enjoy seeing how my work directly helps our customers. I have worked here for over a year, and I wanted to learn more about how Apogee, now 15 years old, came in to being. I did some research through website archives, talked to fellow co-workers, and eventually caught up with our company’s founder and President, Bruce Bugbee, to learn how Apogee got started.

The idea that led to Apogee began when Bruce Bugbee started making inexpensive light meters for his studies as a doctoral student at Penn State University in the late nineteen-seventies. Faculty at universities across the country found these meters to be highly useful and started to request them for their own studies.
In response to this demand for low-priced meters, Apogee Instruments was founded in the spring of 1996 in Bruce’s garage in Logan Utah. Apogee Instruments draws its name from the word ‘apogee’ which means the highest point in an orbit. Bruce had used this name before for a type of short, high-yield wheat that he and his Utah State University students developed for a potential food source for astronauts on long-term missions.
 Apogee’s first product was the quantum meter for measuring photosynthetically active radiation. Other light meters and sensors followed: the pyranometer for measuring shortwave radiation, and the ultraviolet sensor for UV radiation. Apogee also developed an infrared radiometer for use in measuring the surface temperature of plant canopies and other surfaces.
After 10 years in Bruce’s garage, Apogee needed more space. In 2007, Apogee moved into its current location next to Campbell Scientific. Our new building is state-of-the art, highly energy efficient, and is constantly monitored by sensors, many of which are made by Apogee. The new building has extensive facilities for calibrating sensors both inside and outside on a secure rooftop.
Apogee is continuing to grow. Within the next few years Apogee will be releasing several new products. We are also working on improving accuracy of current products and providing all-inclusive recalibration services. Apogee Instruments is dedicated to making high-quality, affordable instruments and providing excellent customer support to back them up. We believe in higher education and support students and research through funding and donations. Apogee strives to be environmentally sustainable, both through our energy-efficient building and providing tools for studying climate change. We hope to support a better tomorrow through creating innovative instrumentation for measuring climate change, improving sustainable food production and developing renewable energy.
Whitney Mortensen
Marketing & Graphic Design

The idea that led to Apogee began when Bruce Bugbee started making inexpensive light meters for his studies as a doctoral student at Penn State University in the late nineteen-seventies. Faculty at universities across the country found these meters to be highly useful and started to request them for their own studies.
In response to this demand for low-priced meters, Apogee Instruments was founded in the spring of 1996 in Bruce’s garage in Logan Utah. Apogee Instruments draws its name from the word ‘apogee’ which means the highest point in an orbit. Bruce had used this name before for a type of short, high-yield wheat that he and his Utah State University students developed for a potential food source for astronauts on long-term missions.
 Apogee’s first product was the quantum meter for measuring photosynthetically active radiation. Other light meters and sensors followed: the pyranometer for measuring shortwave radiation, and the ultraviolet sensor for UV radiation. Apogee also developed an infrared radiometer for use in measuring the surface temperature of plant canopies and other surfaces.
 After 10 years in Bruce’s garage, Apogee needed more space. In 2007, Apogee moved into its current location next to Campbell Scientific. Our new building is state-of-the art, highly energy efficient, and is constantly monitored by sensors, many of which are made by Apogee. The new building has extensive facilities for calibrating sensors both inside and outside on a secure rooftop.
Apogee is continuing to grow. Within the next few years Apogee will be releasing several new products. We are also working on improving accuracy of current products and providing all-inclusive recalibration services. Apogee Instruments is dedicated to making high-quality, affordable instruments and providing excellent customer support to back them up. We believe in higher education and support students and research through funding and donations. Apogee strives to be environmentally sustainable, both through our energy-efficient building and providing tools for studying climate change. We hope to support a better tomorrow through creating innovative instrumentation for measuring climate change, improving sustainable food production and developing renewable energy.
Whitney Mortensen
Marketing & Graphic Design
07 September 2011
Meter Guidelines
The latest version of our meter has been out for 3 years. Based on customer feedback I have compiled this list of ways to use it more effectively.
Battery Life/Master reset
 The meter display is the biggest draw on the battery. The display is designed to shut off if there hasn’t been any activity (button pushing) for two minutes. The battery life can be extended by manually shutting off the display using the power button.
  The meter will continue to record data even when the display is turned off. Pushing the power button again reactivates the display.
The second biggest draw on the battery is long-term storage, even when the meter is not in use. The microcontroller is always on and using a small amount of power. We recommend removing the battery for storage longer than about 9 months to preserve battery life. The meter should normally be turned off before removing the battery. Removing the battery while the meter is on and reinserting it after a few seconds is the master reset, which will erase the data in storage. The master reset also helps to resolve other problems, such as a low battery warning even after putting in a new battery.
Communication Cable
 The AC-100 communication cable provided by Apogee has been uniquely designed to work with the meter and is necessary to download the data to a computer. The meter outputs data using the UART protocol and requires the AC-100 to convert from UART to USB. Other cables with the same connectors on the ends cannot make this conversion.
Data Collection
 The data transmitted to a computer is usually changed into a more readable format by clicking on the file option in the upper left hand corner and choosing one of the two options. Both options transfer the data to a spreadsheet in a vertical configuration. This allows for other parameters, such as time/date, to be entered and auto-filled in the spreadsheet. The most accurate way to know the time of the 30 minute average is by adding 30 minutes to the time when the meter was put into Log Mode. If the start time is not known, the end time can be used but this is less accurate because the number of minutes into a 30 minute average is unknown. The daily total is often more important and is calculated and stored in the meter. The meter is designed to detect when it is night and uses that information to calculate the daily total. The last value in the daily total data thus always represents the previous day.
The Apogee AMS software is available here: http://www.apogeeinstruments.com/files/ApogeeAMS_1.0.zip
These are just a few suggestions that we have received from our customers. If you have more, be sure to comment on this blog so others can make better measurements.
Skif Smith
Electrical Engineering
Battery Life/Master reset

 The meter will continue to record data even when the display is turned off. Pushing the power button again reactivates the display.
 The second biggest draw on the battery is long-term storage, even when the meter is not in use. The microcontroller is always on and using a small amount of power. We recommend removing the battery for storage longer than about 9 months to preserve battery life. The meter should normally be turned off before removing the battery. Removing the battery while the meter is on and reinserting it after a few seconds is the master reset, which will erase the data in storage. The master reset also helps to resolve other problems, such as a low battery warning even after putting in a new battery.
Communication Cable
 The AC-100 communication cable provided by Apogee has been uniquely designed to work with the meter and is necessary to download the data to a computer. The meter outputs data using the UART protocol and requires the AC-100 to convert from UART to USB. Other cables with the same connectors on the ends cannot make this conversion.
Data Collection
The Apogee AMS software is available here: http://www.apogeeinstruments.com/files/ApogeeAMS_1.0.zip
These are just a few suggestions that we have received from our customers. If you have more, be sure to comment on this blog so others can make better measurements.
Skif Smith
Electrical Engineering
31 August 2011
Why silicon pyranometers are the best choice for monitoring solar photovoltaic panel efficiency
Sensors that measure the available solar energy, pyranometers, are an excellent way to monitor the performance of solar photovoltaic panels. They can indicate changes in panel efficiency over time (80% of initial output after 25 years for crystalline silicon) and indicate the need for panel maintenance.
 |
| Figure 1 Spectrum of light produced by the sun and received on the surface through the atmosphere. Source: wikibooks.org |
There are two main types of pyranometers: Blackbody and silicon-cell. Blackbody pyranometers cost $1000 to $5000. Silicon pyranometers are about 10% of this cost.
Blackbody pyranometers use the thermoelectric effect to produce electricity when heated [Myers]. The detector surface has a uniform response to all wavelengths of the solar spectrum, which is defined as 280 to 2800 nm [Moore]. The sun-light incident on the detector heats the surface and a signal is generated that is proportional to the amount of light. This signal is calibrated to match the total integrated intensity of the solar spectrum.
Silicon pyranometers, on the other hand, use a silicon-based photodiode. These typically have a spectral response from about 300 to 1100 nm. Electricity is generated due to the photo-electric effect [Einstein] in the same manner that a solar panel produces electricity. Because of the spectral response, a silicon cell pyranometer subsamples the solar spectrum and its output is calibrated to match that of the entire integrated solar spectrum.
There are instances when the subsampling of a silicon based pyranometer does not accurately represent the entire solar spectrum of light coming through the atmosphere. When sunlight is filtered through the water vapor in clouds, partially-cloudy to overcast conditions, some of the infrared portion of the solar spectrum is reduced, which shifts the spectrum to the shorter wavelengths. This results in a signal from a silicon pyranometers that can be as large as 14% higher than the true total for solar radiation on heavily overcast days [Dupont].
Although blackbody pyranometers accurately measure the integrated total solar spectrum under overcast conditions, this intensity does not represent the radiation available for solar panel power production.
Since the spectral response of silicon-based pyranometers closely matches the spectral response of silicon-based solar panels [Dupont], silicon pyranometers provide better indication of the radiation energy available for conversion to electricity by the solar panel.
Thus using a silicon pyranometer will yield more accurate measurements of panel efficiency. Better measurements of panel efficiency will lead to improved understanding of changes in electrical output and solar panel response.
References
Myers DR, Stoffel TL, Reda I, Wilcox SM and Andreas AM. Recent Progress in Reducing the Uncertainty in and Improving Pyranometer Calibrations. J. Sol. Energy Eng. 124(1):44-51, Feb. 2002. DOI:10.1115/1.1434262
Moore CE, Minnaert MGJ and Houtgast J. The solar spectrum 2935 A to 8770 A. National Bureau of Standards Monograph, Washington: US Government Printing Office (USGPO), 1966.
Einstein A. On a heuristic point of view concerning the production and transformation of light. Annalen der Physik, 1905.
Dupont R, Siemer J, Hirsch M. How Much Sunlight? Photon: The Photovoltaic Magazine, 12:50-67, Dec 2010.

Seth Humphries
Product Development Scientist
24 August 2011
SI Radiation Shield
Air temperature is one of the most important environmental measurements and is the most commonly measured parameter on weather stations. Everyone who measures temperature in their yard can claim to have a basic home weather station.
The temperature of surfaces is considerably more challenging to measure accurately, but the temperature of plants, soils and road surfaces can tell us far more than just a simple measurement of air temperature. The Apogee Infrared Radiometer (IRR), measures surface temperatures by the infrared radiation emitted from them. The accuracy of this sensor is ± 0.2°C, but errors can arise when the sensor body is not shaded from direct solar radiation.
Errors
IRRs can more accurately measure the surface temperature of an object when the sensor body itself is close to the target temperature. The Apogee calibration process accounts for surface temperatures that are 15 C above or below the sensor body temperature. The rule of thumb, however, is that the measurements are more accurate when the sensor body is closer to the target temperature. The question then arises: how can I keep my IRR sensor closer to the target temperature?
Solution
 Apogee recently developed a radiation shield that can be used with our IRR models. This shield keeps the temperature of the sensor closer to the target temperature. As a Mechanical Engineer, I was asked to take the lead in engineering the details of this shield. In order to ensure structural stability, performance, and minimize heat transfer to the IRR sensor, aluminum and nylon were chosen as the chief materials for the shield configuration. Relative to other metals like carbon steels, aluminum has a lower volumetric heat capacity (the ability to store thermal energy), and higher thermal conductivity (ability to conduct heat and thus maintain a uniform temperature across the aluminum). In addition, aluminum is lightweight and robust, thus allowing a smaller amount of material to be used in the wall thickness. Glossy white powder coating allows for a high albedo (more reflected radiation), thus minimizing the thermal radiation absorbed. Nylon screws and spacers are used to attach and suspend the IRR sensor within the shield. Nylon was chosen since it has a thermal conductivity approximately 1000 times less than aluminum, thus minimizing the conduction that occurs from the shield to the IRR sensor. When the IRR sensor is mounted in the aluminum shield, an annulus configuration is formed with approximately 6 mm (0.25”) spacing between the IRR sensor and shield. This spacing is sufficient to allow natural and forced convection to keep the sensor body as close as possible to the air temperature, and thus generally closer to the target temperature.
 The shield extends 14 mm (0.5") beyond the front edge of the sensor base housing. This overhang helps to keep the front of the sensor in thermal equilibrium (at the same temperature) with the rest of the sensor body by shading it from direct sunlight. The overhang distance was carefully selected so it does not affect the field of view of the sensor.
Using the shield appropriately can result in lowering the sensor body temperature 3 to 10°C, giving you better measurements. Currently, the Apogee Radiation Shield, Model AI-100, ships with all newly purchased SI-100 & 200 series IRR sensors, or can be purchased separately as an upgrade to be used with any previously purchased IRR sensors for $39.
The Apogee Radiation Shield – engineered to help you make better measurements.

Adam Del Toro
Mechanical Engineering
The temperature of surfaces is considerably more challenging to measure accurately, but the temperature of plants, soils and road surfaces can tell us far more than just a simple measurement of air temperature. The Apogee Infrared Radiometer (IRR), measures surface temperatures by the infrared radiation emitted from them. The accuracy of this sensor is ± 0.2°C, but errors can arise when the sensor body is not shaded from direct solar radiation.
Errors
IRRs can more accurately measure the surface temperature of an object when the sensor body itself is close to the target temperature. The Apogee calibration process accounts for surface temperatures that are 15 C above or below the sensor body temperature. The rule of thumb, however, is that the measurements are more accurate when the sensor body is closer to the target temperature. The question then arises: how can I keep my IRR sensor closer to the target temperature?
Solution
 The shield extends 14 mm (0.5") beyond the front edge of the sensor base housing. This overhang helps to keep the front of the sensor in thermal equilibrium (at the same temperature) with the rest of the sensor body by shading it from direct sunlight. The overhang distance was carefully selected so it does not affect the field of view of the sensor.
 Using the shield appropriately can result in lowering the sensor body temperature 3 to 10°C, giving you better measurements. Currently, the Apogee Radiation Shield, Model AI-100, ships with all newly purchased SI-100 & 200 series IRR sensors, or can be purchased separately as an upgrade to be used with any previously purchased IRR sensors for $39.
The Apogee Radiation Shield – engineered to help you make better measurements.
Adam Del Toro
Mechanical Engineering
17 August 2011
AM-310 Sensor Wand
 Every spring my preparations for the gardening season start before the snow melts with getting plants started indoors. Light is crucial to establishing vigorous seedlings that will develop into productive plants. People are often tempted to make judgments on light level based on how light is perceived by the eye, but this can lead to incorrect assumptions as the eye can often barely tell the difference between two light sources when one is 200 times greater. In an effort to maximize the available light for my garden starts I grabbed a quantum meter and went to work trying different combinations of lights, covers and windows. I was able to find the most appropriate combination, and had greater success establishing vigorous seedlings than in years past. However, I did find it challenging to get the sensor in just the right place, especially as I was trying to find the best of dozens of combinations. I found myself thinking “I wish I had something I could mount the sensor to and move it around easily to get to hard-to-reach places.” I thought maybe some sort of handle would be good, and then continued to wonder if any of our customers would want the same thing.
  As I thought of all of our customers who are using our quantum meter for research below and above plant canopies, in aquariums and in all sorts of imaginable conditions I realized it would be beneficial to have an extendable wand to get the sensor into hard to reach places. And thus was born the idea for the AM-310, a 36-inch extendable, stainless steel wand with a nice foam rubber grip. The AM-310 is durable and suitable for use under water. It makes it convenient to hold the sensor, even if you don’t have far to reach, and with a collapsed length of less than 8 inches it is never in the way. Using the wand also helps prevent shading by the user’s hand or body, which is a common problem. The AM-310 is also great for use with the UV meter and the pyranometer meter.
 Recently, I used the AM-310 while measuring photosynthetic light levels above field corn and under the canopy of peppers. In both of those situations the AM-310 allowed me to quickly and conveniently make numerous measurements without having to figure out some way to get the sensor higher than I can reach or below knee level without shading it.
Apogee – helping you make better measurements, and now making those better measurements easier to get.

Kyle Roerig
Research Assistant
10 August 2011
7 Habits of Highly Effective Scientists
One of the most important things in any study is the fundamental quality of your measurements. So here are seven steps to help you make better measurements with your Apogee solar radiation sensors.
 1. Situate sensors in ideal conditions
Special care needs to be taken when placing solar sensors for long-term outdoor measurements. Sensors need to be placed where they won’t be in the shadow of any surrounding objects such as trees or power poles. Avoid locations where dripping or splashing can occur on the sensors, or where birds may perch.
2. Correctly Mount the Sensor
Solar radiation sensors should be mounted level to help maintain accurate and consistent measurements from day to day, month to month, and year to year. The cable should be mounted pointing toward true north in the northern hemisphere or true south in the southern hemisphere to minimize azimuth error.
3. Verify wiring connections
Make sure that your wiring is secure and properly connected. Intermittent, and often frustrating, problems can arise when the wiring does not make a good contact with the controller/datalogger being used.
4. Ground the shield wire
Apogee’s solar radiation sensors all come with a cable shield that should be grounded to help mitigate electromagnetic interference (EMI). The shield wire is usually the clear or gray wire.
5. Clean Sensors
Our sensor has a round top to make it self-cleaning, but an occluded diffusion disk is still a common cause of low or erratic readings. Dust and dirt can be cleaned from the sensor’s disk using a non-abrasive cloth or cotton swab sprinkled with deionized water or rubbing alcohol. Calcium deposits, from irrigation water leave a thin white film on the surface that can be removed with a dilute acid such as vinegar.
6. Know what you are measuring
 Being familiar with the sensor’s specifications, operation, and measurements will help you to recognize errors before days or even week’s worth of data becomes unreliable and unusable. Ensure your datalogger program is using the correct multiplier and that the channels in the program match the channels used for the sensor. Many applications benefit from 50 or 60 Hertz noise rejection. A simple method of troubleshooting the datalogger program is to swap a working sensor with a problematic sensor to see if the problem goes away.
7. Calibrate your sensors when needed
We recommend a recalibration cycle of every two to three years for our solar radiation sensors, particularly when using the sensor in extremely hot, outdoor applications. But rather than guessing when you might need a recalibration, we recommend a cheaper, faster method. Our Clear Sky Calculator is designed to calculate the intensity of radiation falling on a horizontal surface, at any time of day, in any location in the world. The calculator outputs a value that can be directly compared to the output of your sensor. For best accuracy, comparisons should be made on clear, non-polluted, summer days within one hour of solar noon. In these conditions the Clear Sky Calculator is within 2% of the actual radiation value.

Jacob Bingham
Applications Engineer
03 August 2011
Understanding Uncertainty in Measurement
 |
| {Photo from Lumq.com} |
For a company, uncertainty is part of business. As we work to improve our products, massive amounts of data are accumulated. How do we communicate the accuracy of our products to our customers? When an improvement is made, does it justify a revision of the published specifications? Several of our board meetings have included discussions on terminology used in writing specifications. The word “typical” appears in specifications from numerous companies. Is “typically” a synonym for “usually”? What percentage of sensors is within the typical accuracy range?
At Apogee, our solar radiation sensors have a specification for accuracy (5%), uniformity (3%) and repeatability (1%). The accuracy compares each sensor’s output to an absolute reference standard. Uniformity is how consistent our sensors are compared to each other. Repeatability refers to how a sensor performs against itself. Does the same sensor perform consistently under the same conditions?
The numbers in our specifications are based on statistical analysis. Large populations of our sensors are compared to a reference, ISO or NIST traceable where available, and the error is measured. We then calculate the mean and standard deviation of the sample from the reference standard. The specifications listed for accuracy, uniformity and repeatability represent plus or minus two standard deviations from the mean (95% of the population).
So, as my professor taught me, there may be no perfect test, but the more we learn and understand the abilities and limitations of the equipment we use, the better our results will be.

Devin Overly
General Manager
18 May 2011

Subscribe to:
Posts (Atom)