31 August 2011

Why silicon pyranometers are the best choice for monitoring solar photovoltaic panel efficiency


Sensors that measure the available solar energy, pyranometers, are an excellent way to monitor the performance of solar photovoltaic panels. They can indicate changes in panel efficiency over time (80% of initial output after 25 years for crystalline silicon) and indicate the need for panel maintenance.
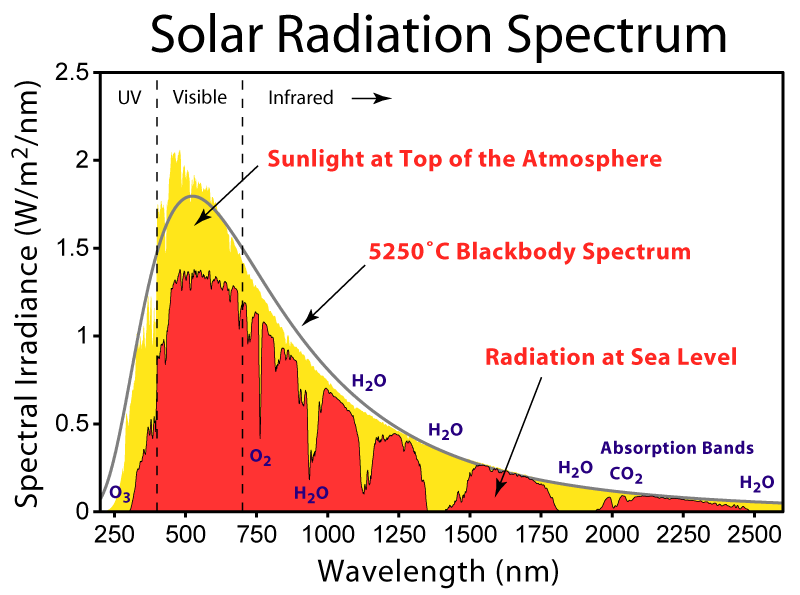
Figure 1 Spectrum of light produced by the sun and received
on the surface through the atmosphere.
Source: wikibooks.org

There are two main types of pyranometers: Blackbody and silicon-cell. Blackbody pyranometers cost $1000 to $5000. Silicon pyranometers are about 10% of this cost.

Blackbody pyranometers use the thermoelectric effect to produce electricity when heated [Myers]. The detector surface has a uniform response to all wavelengths of the solar spectrum, which is defined as 280 to 2800 nm [Moore]. The sun-light incident on the detector heats the surface and a signal is generated that is proportional to the amount of light. This signal is calibrated to match the total integrated intensity of the solar spectrum.

Silicon pyranometers, on the other hand, use a silicon-based photodiode. These typically have a spectral response from about 300 to 1100 nm. Electricity is generated due to the photo-electric effect [Einstein] in the same manner that a solar panel produces electricity. Because of the spectral response, a silicon cell pyranometer subsamples the solar spectrum and its output is calibrated to match that of the entire integrated solar spectrum.

There are instances when the subsampling of a silicon based pyranometer does not accurately represent the entire solar spectrum of light coming through the atmosphere. When sunlight is filtered through the water vapor in clouds, partially-cloudy to overcast conditions, some of the infrared portion of the solar spectrum is reduced, which shifts the spectrum to the shorter wavelengths. This results in a signal from a silicon pyranometers that can be as large as 14% higher than the true total for solar radiation on heavily overcast days [Dupont].

Although blackbody pyranometers accurately measure the integrated total solar spectrum under overcast conditions, this intensity does not represent the radiation available for solar panel power production.

Since the spectral response of silicon-based pyranometers closely matches the spectral response of silicon-based solar panels [Dupont], silicon pyranometers provide better indication of the radiation energy available for conversion to electricity by the solar panel.

Thus using a silicon pyranometer will yield more accurate measurements of panel efficiency. Better measurements of panel efficiency will lead to improved understanding of changes in electrical output and solar panel response.

References
Myers DR, Stoffel TL, Reda I, Wilcox SM and Andreas AM. Recent Progress in Reducing the Uncertainty in and Improving Pyranometer Calibrations. J. Sol. Energy Eng. 124(1):44-51, Feb. 2002. DOI:10.1115/1.1434262

Moore CE, Minnaert MGJ and Houtgast J. The solar spectrum 2935 A to 8770 A. National Bureau of Standards Monograph, Washington: US Government Printing Office (USGPO), 1966.

Einstein A. On a heuristic point of view concerning the production and transformation of light. Annalen der Physik, 1905.

Dupont R, Siemer J, Hirsch M. How Much Sunlight? Photon: The Photovoltaic Magazine, 12:50-67, Dec 2010.


Seth Humphries
Product Development Scientist

24 August 2011

SI Radiation Shield

Air temperature is one of the most important environmental measurements and is the most commonly measured parameter on weather stations. Everyone who measures temperature in their yard can claim to have a basic home weather station.

The temperature of surfaces is considerably more challenging to measure accurately, but the temperature of plants, soils and road surfaces can tell us far more than just a simple measurement of air temperature. The Apogee Infrared Radiometer (IRR), measures surface temperatures by the infrared radiation emitted from them. The accuracy of this sensor is ± 0.2°C, but errors can arise when the sensor body is not shaded from direct solar radiation.

Errors
IRRs can more accurately measure the surface temperature of an object when the sensor body itself is close to the target temperature. The Apogee calibration process accounts for surface temperatures that are 15 C above or below the sensor body temperature. The rule of thumb, however, is that the measurements are more accurate when the sensor body is closer to the target temperature. The question then arises: how can I keep my IRR sensor closer to the target temperature?

Solution
Apogee recently developed a radiation shield that can be used with our IRR models. This shield keeps the temperature of the sensor closer to the target temperature. As a Mechanical Engineer, I was asked to take the lead in engineering the details of this shield. In order to ensure structural stability, performance, and minimize heat transfer to the IRR sensor, aluminum and nylon were chosen as the chief materials for the shield configuration. Relative to other metals like carbon steels, aluminum has a lower volumetric heat capacity (the ability to store thermal energy), and higher thermal conductivity (ability to conduct heat and thus maintain a uniform temperature across the aluminum). In addition, aluminum is lightweight and robust, thus allowing a smaller amount of material to be used in the wall thickness. Glossy white powder coating allows for a high albedo (more reflected radiation), thus minimizing the thermal radiation absorbed. Nylon screws and spacers are used to attach and suspend the IRR sensor within the shield. Nylon was chosen since it has a thermal conductivity approximately 1000 times less than aluminum, thus minimizing the conduction that occurs from the shield to the IRR sensor. When the IRR sensor is mounted in the aluminum shield, an annulus configuration is formed with approximately 6 mm (0.25”) spacing between the IRR sensor and shield. This spacing is sufficient to allow natural and forced convection to keep the sensor body as close as possible to the air temperature, and thus generally closer to the target temperature.

The shield extends 14 mm (0.5") beyond the front edge of the sensor base housing. This overhang helps to keep the front of the sensor in thermal equilibrium (at the same temperature) with the rest of the sensor body by shading it from direct sunlight. The overhang distance was carefully selected so it does not affect the field of view of the sensor.

Using the shield appropriately can result in lowering the sensor body temperature 3 to 10°C, giving you better measurements. Currently, the Apogee Radiation Shield, Model AI-100, ships with all newly purchased SI-100 & 200 series IRR sensors, or can be purchased separately as an upgrade to be used with any previously purchased IRR sensors for $39.

The Apogee Radiation Shield – engineered to help you make better measurements.


Adam Del Toro
Mechanical Engineering


17 August 2011

AM-310 Sensor Wand


Every spring my preparations for the gardening season start before the snow melts with getting plants started indoors. Light is crucial to establishing vigorous seedlings that will develop into productive plants. People are often tempted to make judgments on light level based on how light is perceived by the eye, but this can lead to incorrect assumptions as the eye can often barely tell the difference between two light sources when one is 200 times greater. In an effort to maximize the available light for my garden starts I grabbed a quantum meter and went to work trying different combinations of lights, covers and windows. I was able to find the most appropriate combination, and had greater success establishing vigorous seedlings than in years past. However, I did find it challenging to get the sensor in just the right place, especially as I was trying to find the best of dozens of combinations. I found myself thinking “I wish I had something I could mount the sensor to and move it around easily to get to hard-to-reach places.” I thought maybe some sort of handle would be good, and then continued to wonder if any of our customers would want the same thing.

As I thought of all of our customers who are using our quantum meter for research below and above plant canopies, in aquariums and in all sorts of imaginable conditions I realized it would be beneficial to have an extendable wand to get the sensor into hard to reach places. And thus was born the idea for the AM-310, a 36-inch extendable, stainless steel wand with a nice foam rubber grip. The AM-310 is durable and suitable for use under water. It makes it convenient to hold the sensor, even if you don’t have far to reach, and with a collapsed length of less than 8 inches it is never in the way. Using the wand also helps prevent shading by the user’s hand or body, which is a common problem. The AM-310 is also great for use with the UV meter and the pyranometer meter.

Recently, I used the AM-310 while measuring photosynthetic light levels above field corn and under the canopy of peppers. In both of those situations the AM-310 allowed me to quickly and conveniently make numerous measurements without having to figure out some way to get the sensor higher than I can reach or below knee level without shading it.

Apogee – helping you make better measurements, and now making those better measurements easier to get.


Kyle Roerig
Research Assistant


10 August 2011

7 Habits of Highly Effective Scientists


One of the most important things in any study is the fundamental quality of your measurements.  So here are seven steps to help you make better measurements with your Apogee solar radiation sensors.

1.  Situate sensors in ideal conditions

Special care needs to be taken when placing solar sensors for long-term outdoor measurements. Sensors need to be placed where they won’t be in the shadow of any surrounding objects such as trees or power poles. Avoid locations where dripping or splashing can occur on the sensors, or where birds may perch.

2. Correctly Mount the Sensor

Solar radiation sensors should be mounted level to help maintain accurate and consistent measurements from day to day, month to month, and year to year.  The cable should be mounted pointing toward true north in the northern hemisphere or true south in the southern hemisphere to minimize azimuth error.

3. Verify wiring connections


Make sure that your wiring is secure and properly connected. Intermittent, and often frustrating, problems can arise when the wiring does not make a good contact with the controller/datalogger being used.

4. Ground the shield wire

Apogee’s solar radiation sensors all come with a cable shield that should be grounded to help mitigate electromagnetic interference (EMI). The shield wire is usually the clear or gray wire.

5. Clean Sensors

Our sensor has a round top to make it self-cleaning, but an occluded diffusion disk is still a common cause of low or erratic readings. Dust and dirt can be cleaned from the sensor’s disk using a non-abrasive cloth or cotton swab sprinkled with deionized water or rubbing alcohol. Calcium deposits, from irrigation water leave a thin white film on the surface that can be removed with a dilute acid such as vinegar.

6. Know what you are measuring

Being familiar with the sensor’s specifications, operation, and measurements will help you to recognize errors before days or even week’s worth of data becomes unreliable and unusable. Ensure your datalogger program is using the correct multiplier and that the channels in the program match the channels used for the sensor. Many applications benefit from 50 or 60 Hertz noise rejection. A simple method of troubleshooting the datalogger program is to swap a working sensor with a problematic sensor to see if the problem goes away.

7. Calibrate your sensors when needed

We recommend a recalibration cycle of every two to three years for our solar radiation sensors, particularly when using the sensor in extremely hot, outdoor applications. But rather than guessing when you might need a recalibration, we recommend a cheaper, faster method. Our Clear Sky Calculator is designed to calculate the intensity of radiation falling on a horizontal surface, at any time of day, in any location in the world. The calculator outputs a value that can be directly compared to the output of your sensor. For best accuracy, comparisons should be made on clear, non-polluted, summer days within one hour of solar noon.  In these conditions the Clear Sky Calculator is within 2% of the actual radiation value.


Jacob Bingham
Applications Engineer


03 August 2011

Understanding Uncertainty in Measurement

{Photo from Lumq.com}
One of my university professors went to considerable lengths to communicate the concept that there is no perfect test, driving home the idea that you will always have to live with uncertainty. While this didn’t prohibit him from having numerous exams, it did help me understand that we can never build the perfect instrument. Some researchers believe that acquiring new equipment will give them better results and make them a better scientist. This thinking can be dangerous. Science is not automatically advanced by purchasing new instrumentation. Science is most rapidly advanced by knowing the limitations of your equipment, being aware of the uncertainties and where they arise, understanding the model you are using, and anticipating sources of error and recognizing them when they appear.

For a company, uncertainty is part of business. As we work to improve our products, massive amounts of data are accumulated. How do we communicate the accuracy of our products to our customers? When an improvement is made, does it justify a revision of the published specifications? Several of our board meetings have included discussions on terminology used in writing specifications. The word “typical”  appears in specifications from numerous companies. Is “typically” a synonym for “usually”? What percentage of sensors is within the typical accuracy range?

At Apogee, our solar radiation sensors have a specification for accuracy (5%), uniformity (3%) and repeatability (1%). The accuracy compares each sensor’s output to an absolute reference standard. Uniformity is how consistent our sensors are compared to each other. Repeatability refers to how a sensor performs against itself. Does the same sensor perform consistently under the same conditions?

The numbers in our specifications are based on statistical analysis. Large populations of our sensors are compared to a reference, ISO or NIST traceable where available, and the error is measured. We then calculate the mean and standard deviation of the sample from the reference standard. The specifications listed for accuracy, uniformity and repeatability represent plus or minus two standard deviations from the mean (95% of the population).

So, as my professor taught me, there may be no perfect test, but the more we learn and understand the abilities and limitations of the equipment we use, the better our results will be.


Devin Overly
General Manager